
Diagnostic accuracy of ultrasonography for the detection of hepatic steatosis: an updated meta-analysis of observational studies


Abstract
Aim: We examined the diagnostic accuracy of ultrasonography to detect any HS (defined as steatotic hepatocytes ≥ 5% on histology) and moderate-severe HS (defined as steatotic hepatocytes ≥ 30% on histology) by performing a systematic review and meta-analysis.
Methods: We systematically searched PubMed, Web of Science, and Scopus databases, from January 2011 to February 2021, to identify studies conducted in adults investigating the diagnostic accuracy of ultrasonography vs. histology for detecting either ≥ 5% histologically defined HS or moderate-severe HS (≥ 30%). Meta-analysis was performed using random-effects modeling.
Results: Twelve studies were included involving a total of 2921 individuals, 1710 (58.5%) of whom had HS ≥ 5% by histology. The overall sensitivity, specificity, positive likelihood ratio, and negative likelihood ratio of ultrasonography for the detection of ≥ 5% histologically defined HS, compared to histology, were 82% (95% confidence interval 76%-86%), 80% (72%-86%), 4.0 (2.90-5.70), and 0.23 (0.18-0.30), respectively. Based on the pooled analysis of seven studies, the overall sensitivity, specificity, positive likelihood ratio, and negative likelihood ratio of ultrasonography for the detection of ≥ 30% histologically defined HS were 85% (72%-92%), 85% (73%-93%), 5.72 (3.06-10.7), and 0.18 (0.10-0.33) , respectively. Funnel plots did not reveal any significant publication bias.
Conclusion: Conventional ultrasonography allows for reliable and accurate detection of ≥ 5% histologically defined HS compared to histology. These findings call for an extensive use of conventional ultrasonography in the clinical arena.
Keywords
INTRODUCTION
Hepatic steatosis (HS) is histologically defined by accumulation of triglycerides in > 5% of hepatocytes[1], and it is now realized that lipid accumulation represents a disease state[2]. HS is associated with adverse hepatic and extra-hepatic clinical outcomes, spanning progressive fibrosing liver disease[3] to increased risks of incident type 2 diabetes mellitus (T2DM)[4], chronic kidney disease[5], cardiovascular disease[6,7], and extra-hepatic malignancies[8]. HS results from an imbalance between hepatic de novo lipogenesis and the capacity of hepatocytes to either oxidize or export excess lipid. HS is influenced by many exogenous and endogenous stimuli, such as excessive alcohol consumption, viruses, drugs, and hereditary or endocrine-metabolic diseases[1]. However, from a probabilistic point of view, HS will most commonly occur due to nonalcoholic fatty liver disease (NAFLD)[3]. In this specific setting, quantitative alterations of hepatic fat content play a key role in determining the development and progression of liver disease[9]; therefore, it is important to be able to accurately detect HS to establish a diagnosis of NAFLD.
Currently, there are several diagnostic tests available to diagnose HS, including non-invasive biomarkers, imaging techniques, and liver biopsy[10]. The utilization of such diagnostic methods largely depends on local availability of resources to be destined to the diagnosis and management of this common and frequently asymptomatic liver disease. For example, scientific guidelines provide conflicting advice as to whether specific populations at risk for this condition should be subjected to screening for asymptomatic NAFLD[11]. Nevertheless, scientific societies and authorities agree that, because of its widespread availability and excellent precision, liver ultrasonography should be the first-line diagnostic tool for assessing suspected HS[10,12-14]. In addition, ultrasonography allows prompt identification of focal liver diseases, metastases, hepatocellular carcinoma, and gallstones as causes of abnormal liver function tests. Compared to more expensive imaging methods (such as magnetic resonance-based techniques), ultrasonography is also more widely available[15]. Ultrasonography has a poor sensitivity for detecting mild HS (< 30% of steatotic hepatocytes on histology)[16,17], whereas more recent investigations suggested that semi-quantitative indices, such as the ultrasonographic fatty liver indicator applied to conventional ultrasonography, may facilitate accurate detection of mild HS, i.e., corresponding to a minimum amount of 10% HS, as assessed histologically[18].
Despite this background of evidence attesting to the superiority of ultrasonography in the initial assessment of HS, more contemporary comparative data are required that assess the diagnostic accuracy of ultrasonography with different levels of HS. Therefore, we undertook a systematic review and meta-analysis to compare the diagnostic accuracy of ultrasonography to detect: (1) any HS (defined as steatotic hepatocytes ≥ 5% on histology); and (2) moderate-severe HS (defined as steatotic hepatocytes ≥ 30% on histology). We identified all observational studies, which were published over the last 10 years after the pioneering meta-analysis undertaken by Hernaez et al.[16] in 2011.
METHODS
Review protocol registration
The protocol of the meta-analysis was registered in advance in PROSPERO database (International Prospective Register of Systematic Reviews) with the following code registration number: CRD#42020183739.
Data sources and searches
We systematically searched in PubMed, Scopus, and Web of Science databases to identify all observational studies, published from 1 January 2011 (to identify all studies published after the aforementioned meta-analysis by Hernaez et al.[16]) to 28 February 2021, assessing the diagnostic accuracy of conventional ultrasonography for the detection of either ≥ 5% histologically defined HS or moderate-severe HS in relation to liver biopsy, which is the “gold standard” method for diagnosing and staging HS[12]. Only studies conducted in adult individuals (> 18 years) were included. No restrictions in terms of sex, race, or ethnicity were adopted. Exclusion criteria were: (1) abstracts, reviews, editorials, commentaries, and guidelines; and (2) non-English-language articles. Studies using ultrasound techniques other than conventional ultrasonography (e.g., Doppler, transient elastography, contrast-enhanced ultrasound, or quantitative ultrasound fat estimation) were also excluded. Overall, the eligible studies were identified using the free text terms: “fatty liver” OR “nonalcoholic fatty liver disease” OR “NAFLD” OR “chronic viral hepatitis” OR “chronic liver diseases” AND “ultrasonography” OR “ultrasound” IN “humans”. We performed a systematic review in accordance with the Preferred Reporting Items for Systematic Reviews and Meta-Analyses guidelines (http://www.prisma-statement.org). Additionally, given that the included studies were observational in design, we followed the Meta-analysis Of Observational Studies in Epidemiology guidelines for the meta-analysis of these studies[19].
Data extraction and quality assessment
Two investigators (Ballestri S and Mantovani A) independently evaluated titles and abstracts and subsequently obtained full texts of relevant papers. Working independently, these two investigators read the articles and judged whether they met the inclusion criteria. Discrepancies were resolved by discussion with a third author (Targher G). For all studies, we extracted information on sample size, population characteristics, study country, sensitivity, and specificity, as well as the numbers of true positives, true negatives, false positives, and false negatives. In the case of multiple publications, we included the most up-to-date or comprehensive information. We did not contact any corresponding authors of the eligible studies in order to obtain additional information. Two authors (Ballestri S and Mantovani A) independently assessed the risk of bias. Since all the eligible studies had an observational design, the Newcastle-Ottawa Scale (NOS) was used to assess the quality of each study, as recommended by the Cochrane Collaboration[20]. The NOS assigns a maximum of four stars for selection (or five stars in the case of cross-sectional studies), two stars for comparability, and three stars for outcome/exposure. We judged studies that received a score of at least eight stars to be at low risk of bias (i.e., thus reflecting the highest study quality).
Data synthesis and analysis
The primary measures of the meta-analysis were the diagnostic accuracy of conventional ultrasonography for the detection of either ≥ 5% histologically defined HS or ≥ 30% histologically defined HS (i.e., moderate-severe HS) compared to liver biopsy, taken as the gold standard. The overall sensitivity, specificity, positive and negative likelihood ratios (LR+ and LR-, which are estimated, respectively, by the ratio of the proportion of positive and negative tests in the diseased vs. non-diseased individuals), and the diagnostic odds ratio (DOR, calculated as the LR+ divided by the LR-) were obtained for each eligible study and subsequently combined in the meta-analysis[20]. The meta-analysis was carried out using random-effects modeling as this methodology takes into account any differences between studies even if there is no statistically significant heterogeneity. The Cochran Q chi-square test and the I2-statistics were used to assess the heterogeneity across the eligible studies[20]. Presence of high heterogeneity was defined when the result of the Q test was significant (P < 0.05) and I2-statistics > 50%[20]. Subgroup analyses by study country, causes of HS, publication year (2010-2014 vs. 2015-2020), population age (above the median), or levels of body mass index [(BMI) above the median] were planned to be used where the heterogeneity was high (I2 > 50%) and the number of available studies was more than ten[21]. We also performed the summary receiver operating characteristics (ROC) curve analysis and the respective area under the curve was used as a global measure of test performance[20]. The possibility of publication bias was evaluated by visual inspection of the funnel plots and by the Deeks’s test, which is the preferred statistical analysis to formally test for publication bias in studies assessing diagnostic test accuracy[22]. The Fagan’s nomogram was used to estimate the clinical value of the index test[23]. This nomogram is a two-dimensional graphical tool for estimating how much a diagnostic test result changes the probability that a subject has the disease in question. All statistical tests were two sided and a significance level of P < 0.05 was considered. All analyses were performed with STATA® version 16.1 (Stata, College Station, TX, USA). Specifically, we used “metandi” and “midas” commands.
RESULTS
Literature search and study characteristics
Supplementary Figure 1 shows the results of the literature research and study selection. Based on the titles and abstracts of 2467 selected citations (after excluding all duplicates), we initially identified 16 potentially relevant studies that were published between 1 January 2011 and 28 February 2021. Table 1 describes the syntax used and the records identified through database searching. After examining the full text of these publications, we excluded four studies owing to unsatisfactory inclusion criteria or unsatisfactory outcome measures [Table 2]. As a consequence of this selection strategy, twelve observational studies[18,24-34] comparing the diagnostic accuracy of ultrasonography to liver histology were included in the meta-analysis and were assessed for quality (as summarized in Table 3). These studies included 2921 middle-aged participants (mean age 45 ± 7 years; mean BMI 29 ± 9 kg/m2), 1710 (58.5%) of whom had ≥ 5% histologically defined HS. As also shown in the table, about two thirds of these participants had mild HS (5%-30% of steatotic hepatocytes on histology), whereas one third of participants had moderate-severe HS (≥ 30% histologically defined HS). Among the 12 eligible studies, four studies were carried out in Europe (Italy, Netherlands, and Germany), four studies in the United States, and four studies in Asia (South Korea, China, Pakistan, and Taiwan). In addition, six studies included patients with NAFLD, four studies involved patients with chronic viral hepatitis B or C, and two studies enrolled patients with various chronic liver diseases, including NAFLD and chronic viral hepatitis. Overall, four studies received eight stars on the NOS (indicating an overall low risk of bias) and the remaining eight studies received six or seven stars (indicating an overall medium risk of bias), thereby suggesting an overall medium-low risk of bias.
Syntax used and records identified through database searching
| PubMed <from January 1, 2011 to February 28, 2021> | |||
| #1 | Search "fatty liver AND ultrasonography” IN “humans” | 2333 | |
| #2 | Search "fatty liver AND ultrasound” IN “humans” | 2703 | |
| #3 | Search "nonalcoholic fatty liver disease AND ultrasonography” IN “humans” | 1636 | |
| #4 | Search "nonalcoholic fatty liver disease AND ultrasound” IN “humans” | 1940 | |
| #5 | Search "NAFLD AND ultrasonography” IN “humans” | 1608 | |
| #6 | Search "NAFLD AND ultrasound” IN “humans” | 1913 | |
| #7 | Search " chronic viral hepatitis AND ultrasonography” IN “humans” | 612 | |
| #8 | Search " chronic viral hepatitis AND ultrasound” IN “humans” | 688 | |
| #9 | Search " chronic viral disease AND ultrasonography” IN “humans” | 1585 | |
| #10 | Search " chronic viral disease AND ultrasound” IN “humans” | 1724 | |
| #11 | Search “NAFLD OR chronic viral disease AND ultrasonography” IN “humans” | 2730 | |
| Scopus <from January 1, 2011 to February 28, 2021> | |||
| #1 | Search "fatty liver AND ultrasonography” IN “humans” | 3125 | |
| #2 | Search "fatty liver AND ultrasound” IN “humans” | 3248 | |
| #3 | Search "nonalcoholic fatty liver disease AND ultrasonography” IN “humans” | 2230 | |
| #4 | Search "nonalcoholic fatty liver disease AND ultrasound” IN “humans” | 2262 | |
| #5 | Search "NAFLD AND ultrasonography” IN “humans” | 1489 | |
| #6 | Search "NAFLD AND ultrasound” IN “humans” | 2733 | |
| #7 | Search "chronic viral hepatitis AND ultrasonography” IN “humans” | 1313 | |
| #8 | Search "chronic viral hepatitis AND ultrasound” IN “humans” | 2805 | |
| #9 | Search "chronic viral disease AND ultrasonography” IN “humans” | 1513 | |
| #10 | Search "chronic viral disease AND ultrasound” IN “humans” | 3220 | |
| #11 | Search “NAFLD OR chronic viral disease AND ultrasonography” IN “humans” | 1196 | |
| Web of Science <from January 1, 2011 to February 28, 2021> | |||
| #1 | Search "fatty liver AND ultrasonography” IN “humans” | 1242 | |
| #2 | Search "fatty liver AND ultrasound” IN “humans” | 1785 | |
| #3 | Search "nonalcoholic fatty liver disease AND ultrasonography” IN “humans” | 580 | |
| #4 | Search "nonalcoholic fatty liver disease AND ultrasound” IN “humans” | 758 | |
| #5 | Search "NAFLD AND ultrasonography” IN “humans” | 837 | |
| #6 | Search "NAFLD AND ultrasound” IN “humans” | 1086 | |
| #7 | Search "chronic viral hepatitis AND ultrasonography” IN “humans” | 103 | |
| #8 | Search "chronic viral hepatitis AND ultrasound” IN “humans” | 298 | |
| #9 | Search "chronic viral disease AND ultrasonography” IN “humans” | 87 | |
| #10 | Search "chronic viral disease AND ultrasound” IN “humans” | 255 | |
| #11 | Search “NAFLD OR chronic viral disease AND ultrasonography” IN “humans” | 3117 | |
Studies excluded at the eligibility step of PRISMA diagram
| Author, year | PMID | Country | Sample size (n) | Exclusion criteria |
| Xu et al.[50], 2017 | 28433586 | China | 366 | Unsatisfactory inclusion criteria |
| García-Monzón et al.[51], 2015 | 25708133 | Spain | 111 | Unsatisfactory study design |
| Nelson et al.[52], 2020 | 31647137 | USA | 208 | Unsatisfactory inclusion criteria |
| Loy et al.[53], 2016 | 27298639 | Italy | 88 | Unsatisfactory study design |
Main characteristics of the eligible studies (n = 12) evaluating the sensitivity and specificity of ultrasonography for identifying hepatic steatosis on histology as gold standard
| Author, year | PMID | Study country/region | Sample size | Study population | Causes of HS (ultrasonographic criteria used for identifying HS) | Age (years) | BMI | Patients with HS (≥ 5%) on histology (n) | Patients without HS on histology (n) | Patients with mild HS (5%-30%) on histology (n) | Patients with moderate-severe HS (≥ 30%) on histology | True positive (n) | True negative (n) | False positive (n) | False negative (n) | NOS |
| Van Werven et al.[24] 2010 | 20574093 | Netherlands | 42* | Patients undergoing hepatic resection for neoplasia | NAFLD (increased echogenicity compared with right kidney and decreased visualization of diaphragm and intrahepatic vessel borders) | 59 | 27 | 20 | 22 | 11 | 9 | 13 | 18 | 5 | 7 | 6 |
| Lee et al.[25] 2010 | 20185194 | South Korea | 161 | Consecutive potential living liver donors | NAFLD (increased echogenicity compared with renal cortex and loss of detail of the portal vein) | 32 | 23 | 60 | 101 | 49 | 11 | 37 | 82 | 23 | 19 | 7 |
| Wu et al.[26] 2012 | 21901286 | USA | 410* | Bariatric surgery patients | NAFLD (increased echogenicity compared with renal cortex and loss of detail of the portal veins) | 46 | 45 | 291 | 119 | NA | NA | 251 | 81 | 38 | 40 | 8 |
| Wang et al.[27] 2013 | 23828144 | Taiwan | 175 | Consecutive patients with chronic hepatitis and indication for liver biopsy | NAFLD (increased echogenicity compared with renal cortex) | 46 | 25 | 111 | 64 | 83 | 28 | 101 | 33 | 10 | 31 | 7 |
| Sohail et al.[28] 2013 | 23930869 | Pakistan | 152 | Patients with chronic HCV | HCV (increased echogenicity compared with renal cortex and loss of detail of the portal vein) | 39 | 23 | 79 | 73 | 45 | 34 | 72 | 69 | 4 | 7 | 7 |
| Macaluso et al.[29] 2014 | 24112998 | Italy | 515 | Patients with chronic HCV | HCV (increase in liver-kidney contrast and evidence of vascular blurring and deep attenuation signs) | 53 | 26 | 251 | 264 | 170 | 81 | 158 | 239 | 93 | 25 | 8 |
| Bril et al.[30] 2015 | 25847730 | USA | 146 | Patients with overweight or obesity undergoing liver biopsy | NAFLD (increased echogenicity compared with renal cortex and loss of detail of the portal vein) | 50 | 34 | 96 | 50 | NA | NA | 60 | 44 | 36 | 6 | 7 |
| Petrick et al.[31] 2015 | 26003548 | USA | 513 | Bariatric surgery patients | NAFLD (fall in echo amplitude with penetration to deep portion of the liver, extent of discrepancy in echo amplitude between liver and kidney, loss of echoes from the portal vein) | 44 | 47 | 348 | 165 | 197 | 151 | 279 | 112 | 70 | 53 | 8 |
| Chen et al.[32] 2016 | 27241724 | China | 189 | Patients with chronic HBV | HBV (increased echogenicity compared with renal cortex and loss of detail of the portal vein) | 37 | 23 | 98 | 91 | 61 | 37 | 87 | 78 | 11 | 14 | 7 |
| Kelly et al.[33] 2017 | 28151547 | USA | 109 | Patients with chronic HBV | HBV (increased echogenicity compared with renal cortex and loss of detail of the portal vein) | 46 | 25 | 48 | 61 | 39 | 9 | 29 | 56 | 5 | 19 | 7 |
| Ballestri et al.[18] 2017 | 28641784 | Italy | 352 | Patients with chronic liver diseases | NAFLD/HBV/HCV (presence of liver-kidney contrast, graded as mild/moderate or severe) | 48 | 27 | 226 | 126 | 86 | 140 | 187 | 116 | 10 | 39 | 8 |
| Petzold et al.[34] 2020 | 32357147 | Germany | 157 | Patients with chronic liver diseases | NAFLD/HBV/HCV (increased echogenicity compared with renal cortex and loss of detail of the portal vein) | 48 | 28 | 82 | 115 | 38 | 44 | 32 | 87 | 28 | 10 | 7 |
Diagnostic accuracy of ultrasonography vs. histology for hepatic steatosis ≥ 5%
Table 3 summarizes the main characteristics of the 12 eligible studies[18,24-34] and provides data on the diagnostic accuracy of ultrasonography compared to histology (gold standard) for the detection of ≥ 5% histologically defined HS. The overall sensitivity of ultrasonography to detect ≥ 5% histologically defined HS was 82% [95% confidence interval (CI): 76%-86%], the specificity was 80% (95%CI: 72%-86%), the LR+ was 4.0 (95%CI: 2.90-5.70) and the LR- was 0.23 (95%CI: 0.18-0.30). The diagnostic odds ratio was 17 (95%CI: 11-28) and the summary area under the ROC curve was 0.87 (95%CI: 0.84-0.90) [Figure 1A and B]. As expected, the heterogeneity for the area under the summary ROC curve was high (I2 = 97%; chi-square: 57.1; df: 2.0; P < 0.001). To obtain the post-test probability, we used the Fagan’s nomogram for which we performed a simulation with an observed prevalence of 58% of ≥ 5% histologically defined HS, based on the pooled prevalence of the 12 eligible studies. The probability in this model of someone having ≥ 5% histologically defined HS and not being detected by ultrasonography was 24% [Figure 2].
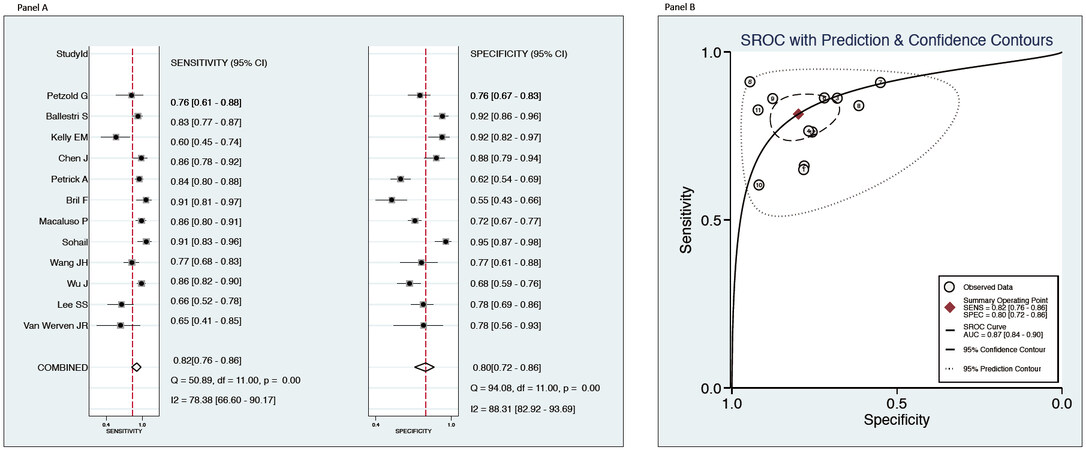
Figure 1. Overall sensitivity and specificity of ultrasonography to detect ≥ 5% histologically defined hepatic steatosis (HS) (A) and the summary receiver-operating characteristic (ROC) curve plots showing the test accuracy of ultrasonography compared to histology to distinguish between presence of ≥ 5% histologically defined HS and the absence of HS (B) in 12 eligible studies.
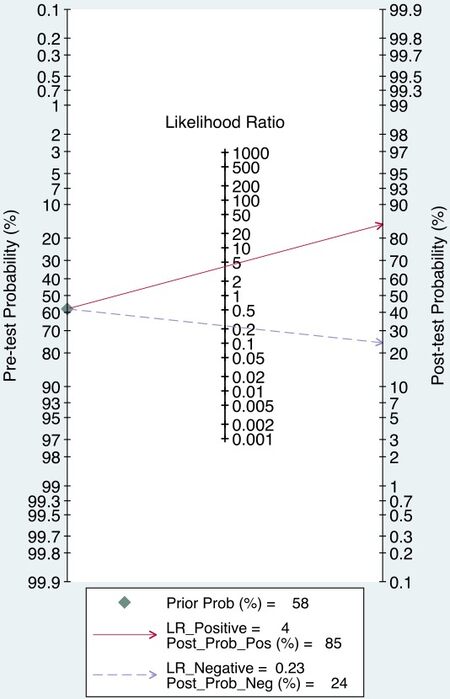
Figure 2. Fagan’s nomogram for ultrasonography to detect ≥ 5% histologically defined hepatic steatosis (HS) from the absence of HS.
As shown in Table 4, the diagnostic performance of ultrasonography for detecting ≥ 5% histologically defined HS remained comparable even when the eligible studies were stratified by study country, causes of HS, publication year, age of participants, or BMI levels. In addition, study country, age of participants, and levels of BMI explained only a small proportion of the aforementioned between-study heterogeneity. Notably, the Deeks’ funnel plot asymmetry test did not show any potential publication bias (P = 0.92) [Supplementary Figure 2].
Subgroup analyses: diagnostic accuracy of conventional ultrasonography, compared to histology, for the detection of ≥ 5% histologically defined HS in eligible studies (n= 12), which were stratified by study country, causes of HS, publication year, age of participants, or levels of body mass index
| Sensitivity (95%CI) | I2 | Specificity (95%CI) | I2 | LR+ (95%CI) | LR- (95%CI) | |
| Study country | ||||||
| Asia (n = 4) | 0.82 (0.71-0.89) | 71% | 0.86 (0.77-0.91) | 80% | 5.81 (3.14-10.8) | 0.21 (0.12-0.38) |
| Europe (n = 4) | 0.83 (0.79-0.86) | 59% | 0.81 (0.70-0.89) | 86% | 4.36 (2.70-7.06) | 0.21 (0.17-0.26) |
| United States (n = 4) | 0.82 (0.71-0.89) | 72% | 0.71 (0.52-0.85) | 40% | 2.84 (1.76-4.59) | 0.25 (0.18-0.35) |
| Causes of HS* | ||||||
| NAFLD (n = 6) | 0.82 (0.75-0.87) | 70% | 0.73 (0.64-0.80) | 87% | 3.02 (2.27-4.00) | 0.25 (0.19-0.33) |
| Viral hepatitis B or C (n = 5) | 0.79 (0.61-0.88) | 88% | 0.85 (0.70-0.94) | 93% | 4.79 (1.81-12.5) | 0.24 (0.14-0.44) |
| Publication year | ||||||
| From 2010 to 2014 (n = 6) | 0.81 (0.73-0.88) | 82% | 0.79 (0.69-0.86) | 76% | 3.81 (2.49-5.84) | 0.24 (0.15-0.36) |
| From 2015 to 2020 (n = 6) | 0.82 (0.75-0.87) | 78% | 0.81 (0.66-0.90) | 93% | 4.23 (2.40-7.43) | 0.22 (0.17-0.30) |
| Population age (above the median) | ||||||
| ≤ 46 years (n = 7) | 0.81 (0.73-0.87) | 86% | 0.82 (0.71-0.89) | 89% | 4.44 (2.71-7.28) | 0.24 (0.16-0.34) |
| > 46 years (n = 5) | 0.85 (0.81-0.88) | 62% | 0.77 (0.64-0.86) | 89% | 3.68 (2.27-5.97) | 0.20 (0.16-0.25) |
| Body mass index (above the median) | ||||||
| ≤ 27 kg/m2 (n = 8) | 0.79 (0.71-0.85) | 81% | 0.85 (0.78-0.90) | 85% | 5.42 (3.50-8.39) | 0.24 (0.17-0.35) |
| > 27 kg/m2 (n = 4)§ | 0.85 (0.81-0.88) | 40% | 0.65 (0.57-0.72) | 72% | 2.44 (2.01-2.97) | 0.23 (0.19-0.29) |
Diagnostic accuracy of ultrasonography vs. histology for hepatic steatosis ≥ 30%
Combining together the results of the seven eligible studies[18,25,27,29,31,32,34] involving a total of 2062 middle-aged individuals, which tested the diagnostic accuracy of ultrasonography for the detection of ≥ 30% histologically defined HS, we found that the overall sensitivity of ultrasonography to detect HS was 85% (95%CI: 72%-92%), specificity was 85% (95%CI: 73%-93%), LR+ was 5.72 (95%CI: 3.06-10.7), and LR- was 0.18 (95%CI: 0.10-0.33). The diagnostic odds ratio was 32 (95%CI: 13-77) and the summary area under the ROC curve was 0.92 (0.89-0.94) [Figure 3A and B]. As expected, the heterogeneity for the area under the summary ROC curve was high (I2 = 98%; chi-square: 99.1; df: 2.0; P < 0.001). To obtain the post-test probability, we used Fagan’s nomogram for which we performed a simulation with an observed prevalence of 26% for moderate-severe HS, based on the pooled prevalence of moderate-severe HS in these seven eligible studies. The probability in this model of someone having moderate-severe HS and not being detected by ultrasonography was 6% [Figure 4]. In addition, the Deeks’ funnel plot asymmetry test did not show any significant publication bias (P = 0.43) Supplementary Figure 3.
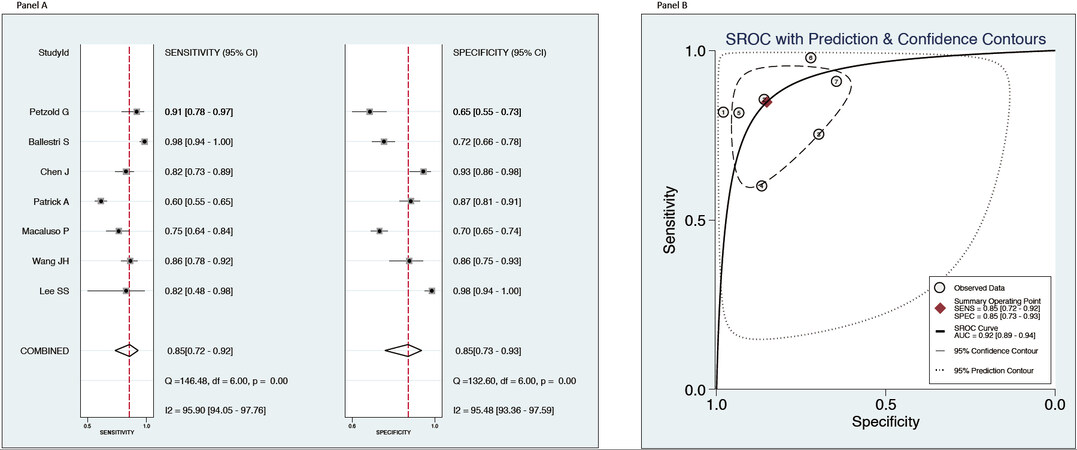
Figure 3. Overall sensitivity and specificity of ultrasonography to detect ≥ 30% (moderate-severe) histologically defined hepatic steatosis (HS) (A) and the summary receiver-operating characteristic (ROC) curve plots showing the test accuracy of ultrasonography compared to histology to distinguish between presence of moderate-severe HS and the absence of HS (B) in seven eligible studies.
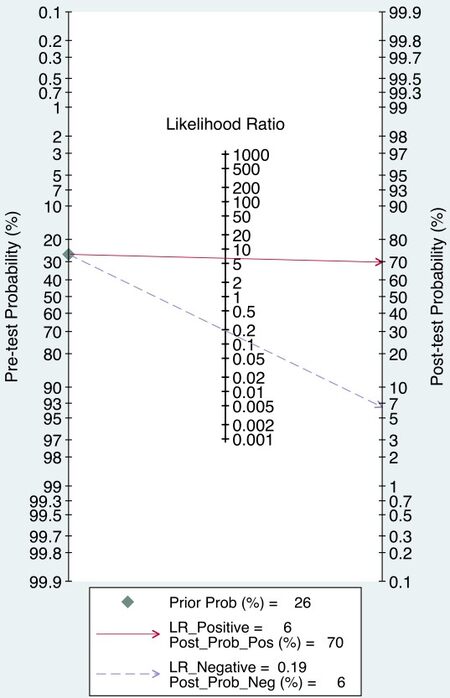
Figure 4. Cally-Fagan’s nomogram for ultrasonography to detect moderate-severe hepatic steatosis (HS) from the absence of HS.
DISCUSSION
Our updated systematic review and meta-analysis of 12 observational studies published during the last decade (from January 2011 to February 2021) was aimed at examining the diagnostic accuracy of ultrasonography versus histology (gold standard) for the detection of either ≥ 5% histologically defined HS or moderate-severe HS (≥ 30% histologically defined HS). The major findings of our meta-analysis are that conventional ultrasonography allows for reliable and accurate detection of ≥ 5% histologically defined HS (82% sensitivity and 80% specificity), as well as moderate-severe HS (85% sensitivity and 85% specificity), compared to liver histology. It should be noted that approximately two thirds of the subjects included in this meta-analysis had mild HS (i.e., less than 30% steatotic hepatocytes on histology).
At first glance, our finding on the diagnostic accuracy of ultrasonography for the detection of ≥ 5% histologically defined HS is at variance with previous studies published before 2010. Indeed, we found that overall sensitivity of conventional ultrasonography for the detection of ≥ 5% histologically defined HS was much better (82% sensitivity) than that reported in a previous meta-analysis of 49 studies published between 1979 and 2010 by Hernaez et al.[16] (65% sensitivity). In contrast, in both meta-analyses, overall specificity was very similar (80% in our study compared with 81% in[16]). Conversely, our finding on the diagnostic accuracy of ultrasonography for the detection of ≥ 30% histologically defined HS (85% sensitivity and 85% specificity) appears to be very similar to that previously reported in the meta-analysis of
The reasons for the improved diagnostic accuracy of ultrasonography for the detection of ≥ 5% histologically defined HS in our meta-analysis, compared with that of Hernaez et al.[16] published over a decade ago, are not apparent. However, it is important to remember that we only included studies published during the last decade, whereas Hernaez et al.[16] included studies published between 1979 and 2010. Thus, we consider that this improved diagnostic accuracy of ultrasonography for the detection of ≥ 5% histologically defined HS could be, in large part, due to technical evolution/improvement in the ultrasonographic equipment and increased operator awareness of HS over the last years.
By definition, the presence of HS is a prerequisite for the diagnosis of NAFLD[12]. In NAFLD, the presence of imaging-defined or biopsy-proven HS is associated with liver disease progression and predicts overall mortality and the risk of incident T2DM and other extra-hepatic diseases[4,5,8,35,36]. Consistently, improvement or resolution of HS on ultrasonography decreases the risk of incident T2DM in patients with NAFLD[37]. Furthermore, HS has recently been identified as a major diagnostic and therapeutic target in NAFLD[38-41]. Accumulating clinical evidence shows that lifestyle changes and various drug treatment options may improve HS[42-47]. Therefore, the ability to monitor HS over time using non-invasive imaging methods is crucial in routine clinical practice to gauge treatment responses. Collectively, the findings of our meta-analysis support a wider clinical use of liver ultrasonography, which is a cheap, reproducible, and globally available tool that is both sensitive and specific in identifying HS of varying severity. Additionally, assessment of HS by the most recent ultrasonography equipment may be combined with the non-invasive measurement of liver fibrosis to assess the severity of NAFLD and its inherent cardiovascular risk[48].
New ultrasound techniques, including controlled attenuation parameter (CAP) obtained by transient elastography (Fibroscan®, Echosens, Paris), have also been proposed to quantitatively assess HS[15]. Fibroscan® equipped with CAP has shown a good accuracy for detecting HS and has the advantage of simultaneously estimating liver fibrosis, being coupled with liver stiffness measurement[14,15]. Moreover, spleen size, as assessed by ultrasonography, might be also useful for staging NAFLD, since a larger spleen volume has been associated with the more advanced forms of NAFLD (cirrhosis)[49].
Our meta-analysis has some important limitations that should be mentioned. Firstly, we did not include other newer ultrasound techniques (e.g., sonographic hepato-renal index) that could further improve quantification of low levels of HS. Secondly, the eligible studies did not provide any specific data about the diagnostic accuracy of conventional ultrasonography for the differential detection of mild HS (defined by less than 30% steatotic hepatocytes on histology) and moderate-severe HS (≥ 30% steatotic hepatocytes). Thirdly, we did not have individual patient data and, therefore, were unable to test the diagnostic performance of liver ultrasonography in specific patient subgroups.
In conclusion, by evaluating the diagnostic accuracy of conventional ultrasonography for the detection of either ≥ 5% histologically defined HS or moderate-severe HS, we found that ultrasonography is both sensitive and specific in identifying HS, in its mild as well as severe form, as compared to liver histology. These findings call for a more extensive use of conventional ultrasonography both in clinics and in research.
DECLARATIONS
Authors’ contributionsConceptualization, methodology, software, resources and supervision: Lonardo A, Targher G
Investigation, validation and data curation: Ballestri S, Mantovani A, Lonardo A, Targher G
Formal statistical analysis: Mantovani A, Targher G
Writing - original draft preparation: Byrne CD, Targher G
Writing - reviewing and editing: Ballestri S, Mantovani A, Byrne CD, Lonardo A, Targher G
Availability of data and materialsNot applicable.
Financial support and sponsorshipTargher G is supported in part by grants from the Department of Medicine, University of Verona, Verona, Italy. Byrne CD is supported in part by the Southampton NIHR Biomedical Research Centre (IS-BRC-20004), UK.
Conflicts of interestAll authors declared that there are no conflicts of interest.
Ethical approval and consent to participateThe protocol of the meta-analysis was registered in advance in PROSPERO database (International Prospective Register of Systematic Reviews) with the following code registration number: CRD#42020183739.
Consent for publicationNot applicable.
Copyright© The Author(s) 2023.
Supplementary MaterialsREFERENCES
2. Lonardo A. Fatty liver and nonalcoholic steatohepatitis. Where do we stand and where are we going? Dig Dis 1999;17:80-9.
3. AISF position paper on nonalcoholic fatty liver disease (NAFLD): updates and future directions. Dig Liver Dis 2017;49:471-83.
4. Mantovani A, Petracca G, Beatrice G, et al. Non-alcoholic fatty liver disease and risk of incident diabetes mellitus: an updated meta-analysis of 501 022 adult individuals. Gut 2020; doi: 10.1136/gutjnl-2020-322572.
5. Mantovani A, Petracca G, Beatrice G, et al. Non-alcoholic fatty liver disease and risk of incident chronic kidney disease: an updated meta-analysis. Gut 2020; doi: 10.1136/gutjnl-2020-323082.
6. Anstee QM, Mantovani A, Tilg H, et al. Risk of cardiomyopathy and cardiac arrhythmias in patients with nonalcoholic fatty liver disease. Nat Rev Gastroenterol Hepatol 2018;15:425-39.
7. Lonardo A, Nascimbeni F, Mantovani A, Targher G. Hypertension, diabetes, atherosclerosis and NASH: cause or consequence? J Hepatol 2018;68:335-52.
8. Mantovani A, Petracca G, Beatrice G, et al. Non-alcoholic fatty liver disease and increased risk of incident extrahepatic cancers: a meta-analysis of observational cohort studies. Gut 2021; doi: 10.1136/gutjnl-2021-324191.
9. Valenti L, Pelusi S. Redefining fatty liver disease classification in 2020. Liver Int 2020;40:1016-7.
11. Leoni S, Tovoli F, Napoli L, et al. Current guidelines for the management of non-alcoholic fatty liver disease: a systematic review with comparative analysis. World J Gastroenterol 2018;24:3361-73.
12. Association for the Study of the L, European Association for the Study of D, European Association for the Study of O. EASL-EASD-EASO Clinical Practice Guidelines for the management of non-alcoholic fatty liver disease. J Hepatol 2016;64:1388-402.
13. Wong VW, Chan WK, Chitturi S, et al. Asia-Pacific working party on non-alcoholic fatty liver disease guidelines 2017-Part 1: definition, risk factors and assessment. J Gastroenterol Hepatol 2018;33:70-85.
14. Byrne CD, Patel J, Scorletti E, et al. Tests for diagnosing and monitoring non-alcoholic fatty liver disease in adults. BMJ 2018;362:k2734.
15. Ballestri S, Nascimbeni F, Lugari S, et al. A critical appraisal of the use of ultrasound in hepatic steatosis. Expert Rev Gastroenterol Hepatol 2019;13:667-81.
16. Hernaez R, Lazo M, Bonekamp S, et al. Diagnostic accuracy and reliability of ultrasonography for the detection of fatty liver: a meta-analysis. Hepatology 2011;54:1082-90.
17. Eslam M, Newsome PN, Sarin SK, et al. A new definition for metabolic dysfunction-associated fatty liver disease: an international expert consensus statement. J Hepatol 2020;73:202-9.
18. Ballestri S, Nascimbeni F, Baldelli E, et al. Ultrasonographic fatty liver indicator detects mild steatosis and correlates with metabolic/histological parameters in various liver diseases. Metabolism 2017;72:57-65.
19. Stroup DF, Berlin JA, Morton SC, et al. Meta-analysis of observational studies in epidemiology: a proposal for reporting. Meta-analysis of observational studies in epidemiology (MOOSE) group. JAMA 2000;283:2008-12.
20. Cumpston M, Li T, Page MJ, et al. Updated guidance for trusted systematic reviews: a new edition of the Cochrane Handbook for Systematic Reviews of Interventions. Cochrane Database Syst Rev 2019;10:ED000142.
21. Higgins JP, Thompson SG. Quantifying heterogeneity in a meta-analysis. Stat Med 2002;21:1539-58.
22. Deeks JJ, Macaskill P, Irwig L. The performance of tests of publication bias and other sample size effects in systematic reviews of diagnostic test accuracy was assessed. J Clin Epidemiol 2005;58:882-93.
24. van Werven JR, Marsman HA, Nederveen AJ, et al. Assessment of hepatic steatosis in patients undergoing liver resection: comparison of US, CT, T1-weighted dual-echo MR imaging, and point-resolved 1H MR spectroscopy. Radiology 2010;256:159-68.
25. Lee SS, Park SH, Kim HJ, et al. Non-invasive assessment of hepatic steatosis: prospective comparison of the accuracy of imaging examinations. J Hepatol 2010;52:579-85.
26. Wu J, You J, Yerian L, et al. Prevalence of liver steatosis and fibrosis and the diagnostic accuracy of ultrasound in bariatric surgery patients. Obes Surg 2012;22:240-7.
27. Wang JH, Hung CH, Kuo FY, et al. Ultrasonographic quantification of hepatic-renal echogenicity difference in hepatic steatosis diagnosis. Dig Dis Sci 2013;58:2993-3000.
28. Sohail S, Aziz S, Mirza T. Ultrasound based evaluation of hepatic steatosis and fibrosis in hepatitis C non-responders. J Coll Physicians Surg Pak 2013;23:548-52.
29. Macaluso FS, Maida M, Camma C, et al. Body mass index and liver stiffness affect accuracy of ultrasonography in detecting steatosis in patients with chronic hepatitis C virus genotype 1 infection. Clin Gastroenterol Hepatol 2014;12:878-84. e1.
30. Bril F, Ortiz-Lopez C, Lomonaco R, et al. Clinical value of liver ultrasound for the diagnosis of nonalcoholic fatty liver disease in overweight and obese patients. Liver Int 2015;35:2139-46.
31. Petrick A, Benotti P, Wood GC, et al. Utility of ultrasound, transaminases, and visual inspection to assess nonalcoholic fatty liver disease in bariatric surgery patients. Obes Surg 2015;25:2368-75.
32. Chen J, Wu D, Wang M, et al. Controlled attenuation parameter for the detection of hepatic steatosis in patients with chronic hepatitis B. Infect Dis (Lond) 2016;48:670-5.
33. Kelly EM, Feldstein VA, Etheridge D, et al. Sonography predicts liver steatosis in patients with chronic hepatitis B. J Ultrasound Med 2017;36:925-32.
34. Petzold G, Lasser J, Ruhl J, et al. Diagnostic accuracy of B-Mode ultrasound and Hepatorenal Index for graduation of hepatic steatosis in patients with chronic liver disease. PLoS One 2020;15:e0231044.
35. Mantovani A, Scorletti E, Mosca A, et al. Complications, morbidity and mortality of nonalcoholic fatty liver disease. Metabolism 2020;111S:154170.
36. Simon TG, Roelstraete B, Khalili H, et al. Mortality in biopsy-confirmed nonalcoholic fatty liver disease: results from a nationwide cohort. Gut 2020; doi: 10.1136/gutjnl-2020-322786.
37. Nasr P, Fredrikson M, Ekstedt M, et al. The amount of liver fat predicts mortality and development of type 2 diabetes in non-alcoholic fatty liver disease. Liver Int 2020;40:1069-78.
38. Byrne CD, Targher G. Time to replace assessment of liver histology with MR-based imaging tests to assess efficacy of interventions for nonalcoholic fatty liver disease. Gastroenterology 2016;150:7-10.
39. Ajmera V, Park CC, Caussy C, et al. Magnetic resonance imaging proton density fat fraction associates with progression of fibrosis in patients with nonalcoholic fatty liver disease. Gastroenterology 2018;155:307-10. e2.
40. Caussy C, Reeder SB, Sirlin CB, et al. Noninvasive, quantitative assessment of liver fat by MRI-PDFF as an endpoint in NASH trials. Hepatology 2018;68:763-72.
41. Pelusi S, Valenti L. Hepatic fat as clinical outcome and therapeutic target for nonalcoholic fatty liver disease. Liver Int 2019;39:250-6.
42. Keating SE, Hackett DA, Parker HM, et al. Effect of aerobic exercise training dose on liver fat and visceral adiposity. J Hepatol 2015;63:174-82.
43. Sung KC, Ryu S, Lee JY, et al. Effect of exercise on the development of new fatty liver and the resolution of existing fatty liver. J Hepatol 2016;65:791-7.
44. Kim W, Kim BG, Lee JS, et al. Randomised clinical trial: the efficacy and safety of oltipraz, a liver X receptor alpha-inhibitory dithiolethione in patients with non-alcoholic fatty liver disease. Aliment Pharmacol Ther 2017;45:1073-83.
45. Kotler DP, He Q, Engelson ES, et al. The effect of recombinant human growth hormone with or without rosiglitazone on hepatic fat content in HIV-1-infected individuals: a randomized clinical trial. Antivir Ther 2016;21:107-16.
46. Eriksson JW, Lundkvist P, Jansson PA, et al. Effects of dapagliflozin and n-3 carboxylic acids on non-alcoholic fatty liver disease in people with type 2 diabetes: a double-blind randomised placebo-controlled study. Diabetologia 2018;61:1923-34.
47. Harrison SA, Rinella ME, Abdelmalek MF, et al. NGM282 for treatment of non-alcoholic steatohepatitis: a multicentre, randomised, double-blind, placebo-controlled, phase 2 trial. Lancet 2018;391:1174-85.
48. Ballestri S, Mantovani A, Baldelli E, et al. Liver fibrosis biomarkers accurately exclude advanced fibrosis and are associated with higher cardiovascular risk scores in patients with NAFLD or viral chronic liver disease. Diagnostics (Basel) 2021;11:98.
49. Tarantino G, Citro V, Balsano C. Liver-spleen axis in nonalcoholic fatty liver disease. Expert Rev Gastroenterol Hepatol 2021;15:759-69.
50. Xu L, Lu W, Li P, Shen F, Mi YQ, Fan JG. A comparison of hepatic steatosis index, controlled attenuation parameter and ultrasound as noninvasive diagnostic tools for steatosis in chronic hepatitis B. Dig Liver Dis 2017;49:910-7.
51. García-Monzón C, Vargas-Castrillón J, Porrero JL, et al. Prevalence and risk factors for biopsy-proven non-alcoholic fatty liver disease and non-alcoholic steatohepatitis in a prospective cohort of adult patients with gallstones. Liver Int 2015;35:1983-91.
52. Nelson SM, Hoskins JD, Lisanti C, Chaudhuri J. Ultrasound fatty liver indicator: a simple tool for differentiating steatosis from nonalcoholic steatohepatitis: validity in the average obese population. J Ultrasound Med 2020;39:749-59.
Cite This Article
Export citation file: BibTeX | RIS
OAE Style
Ballestri S, Mantovani A, Byrne CD, Lonardo A, Targher G. Diagnostic accuracy of ultrasonography for the detection of hepatic steatosis: an updated meta-analysis of observational studies. Metab Target Organ Damage 2021;1:7. http://dx.doi.org/10.20517/mtod.2021.05
AMA Style
Ballestri S, Mantovani A, Byrne CD, Lonardo A, Targher G. Diagnostic accuracy of ultrasonography for the detection of hepatic steatosis: an updated meta-analysis of observational studies. Metabolism and Target Organ Damage. 2021; 1(1): 7. http://dx.doi.org/10.20517/mtod.2021.05
Chicago/Turabian Style
Ballestri, Stefano, Alessandro Mantovani, Christopher D. Byrne, Amedeo Lonardo, Giovanni Targher. 2021. "Diagnostic accuracy of ultrasonography for the detection of hepatic steatosis: an updated meta-analysis of observational studies" Metabolism and Target Organ Damage. 1, no.1: 7. http://dx.doi.org/10.20517/mtod.2021.05
ACS Style
Ballestri, S.; Mantovani A.; Byrne CD.; Lonardo A.; Targher G. Diagnostic accuracy of ultrasonography for the detection of hepatic steatosis: an updated meta-analysis of observational studies. Metab Target Organ Damage. 2021, 1, 7. http://dx.doi.org/10.20517/mtod.2021.05
About This Article
Copyright

Data & Comments
Data


 Cite This Article 117 clicks

 Like This Article 19
likes
Like This Article 19
likes


Comments
Comments must be written in English. Spam, offensive content, impersonation, and private information will not be permitted. If any comment is reported and identified as inappropriate content by OAE staff, the comment will be removed without notice. If you have any queries or need any help, please contact us at support@oaepublish.com.